Program architecture
The AHED Software is used for the resolution of thermal designs of Shell and Tube Heat Exchangers (geometries, heat transfer area, baffles, pressure drops, vibration calculations, among others). It is only limited to thermal design. The mechanical design is not part of the AHED Software.
The AHED Software is a client-server application. As such, it requires an Internet connection to work. The AHED application (the client-side of the program) is used by the end user to enter the input parameters of the thermal design problem. Upon calculation, the input parameters are sent to the server where the actual calculations are performed. When finished, the server sends the output results back to the application. From a user point-of-view, it appears as if the application is performing the calculations itself (which is not). In reality everything is done through the Internet using the AHED servers:
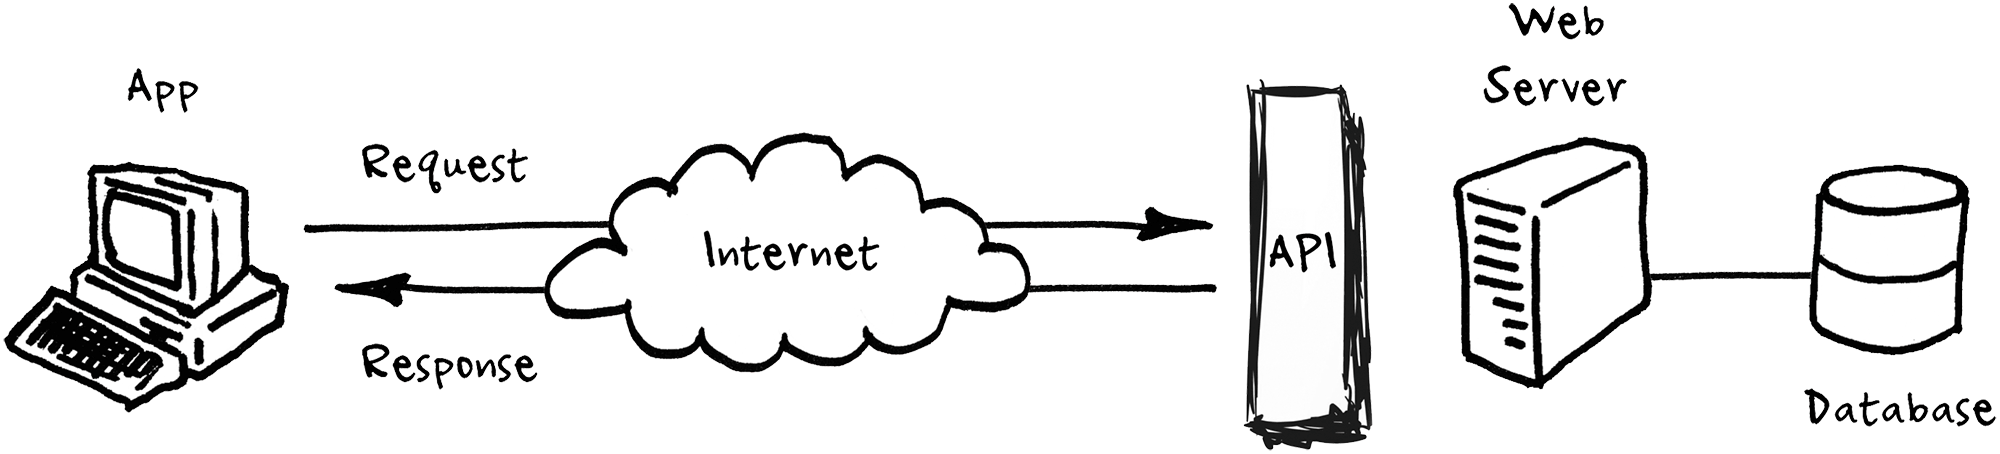
Without a live connection to the Internet, it is not possible to use the AHED software. The server-side of the architecture is responsible for the calculations and the storage of the projects.
An AHED calculation takes place in several steps. The (sequential) procedure is as follows:
- Introduction of Project information.
- Fluid selection / definition (user input data)
-
Heat balance calculation
- Definition of flows and temperatures (user input data)
- Heat balance calculation
-
Geometry calculation
- Geometry selection (user input data)
- Geometry calculation
-
Baffles definition (optional)
- Baffle definition (user input data)
- Baffle calculation
- Overall calculation
- Flow data calculation
- Heat transfer calculation
- Areas calculation
- Logarithmic Mean Temperature Difference (LMTD) calculation
- Pressure drop calculation
- Vibrations calculation
- Flow data calculation
-
Batch calculation (optional)
- Batch definition (user input data)
- Batch calculation
-
Graphs
- Reynolds/Nusselt graphs for both shell side and tubes side
- Temperatures/Area graphs
-
Reports
- Selection of report and generation of report file
Each step in blue involves sending the input data to the server, the data being received, the user and data validated, processed and the resulting data being returned back to the client, so that the results could be seen in the user interface, along with any warning or error that might have occurred. Whenever an error is detected during the calculations at the server side, the current step is halted and the results up to that point are returned to the client application, along with a description of the problem which is marked in in red. Errors prevent the user from advancing to next steps. They must be solved in order to proceed. On the other side, warnings are marked in yellow and they do not block the user from progressing in the calculations. They should however be taken into consideration and fixed, when possible.
General comment: In the program user interface, by clicking F1 when located in any specific parameter, a web page will open where this particular parameter is explained.